How to view hiring reports
Last updated: September 14, 2026
The Hiring Reports tab shows how candidates are performing across your assessments. This article shows you how to read the three headline metrics, filter the report down to a candidate, channel, assessment or scorecard, and export the filtered data as a CSV for use outside Solidroad.
Open the Reports tab
Click Hiring in the left panel, then select the Reports tab. Hiring data is tracked separately from training reporting, so everything on this page relates to candidates only.
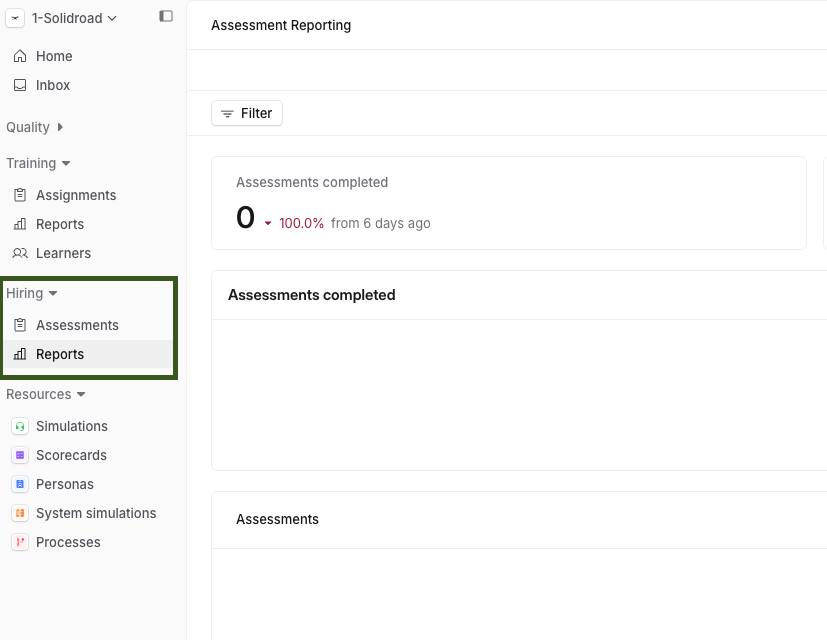
Read the key metrics
The upper-left of the page shows three metrics, each with its own graph:
Assessments completed: the simulations finished by all candidates.
Average score: the average score across all candidates.
Time saved: the live article describes this as the total time candidates spent on their simulations.
Click a metric to switch the graph to it. Hover over any dot on the graph to see the detail behind that point in a pop-up.
Filter the report
The filters on the right side of the page narrow the graph and the data table to what you need.
Use the date range filter to choose 7 days, 14 days, 30 days or a Custom range. The selected dates appear on the graph’s X-axis.
Use the dropdowns Filter by candidate, Filter by Channel, Filter by assessment and Filter by Scorecard to narrow the trend shown.
Scroll down to see the full data table behind the graphs. It updates automatically to match whatever filters you have applied.
Export the data
Set the date range you want first, using the date range filter above. You cannot change it during export.
Click Export.
In the pop-up, choose the data to include.
Click Export Data. Solidroad emails you a download link.
Open the downloaded CSV in a spreadsheet program such as Excel or Google Sheets.
Related articles
If you have any further questions, contact the Solidroad team via the Help tab in the platform.