How to use the QA reporting tool (Quality)
Last updated: July 28, 2026
The QA reporting tool turns your evaluations into a single view of quality performance — average scores, trends over time, top and low performing agents, and a section-by-section breakdown. This guide walks you through building a report from scratch: steps 1–3 get you to your data, steps 4–6 show you how to read and drill into it, and step 7 covers exporting.
Before you start: You'll need Admin or QA access to view Reports. You also need at least one evaluation set up in your workspace - the report is built on top of a completed evaluation.
Step 1: Open the Reports page
The report lives under the Quality section of your workspace.
What to do:
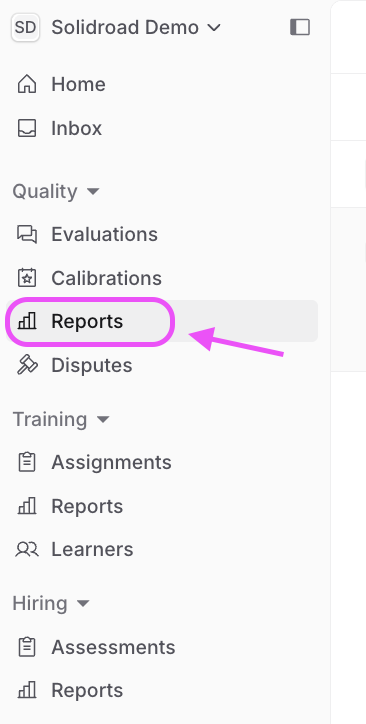
In the left-hand menu, go to Quality → Reports.
Step 2: Choose your evaluation
The evaluation you select decides which conversations and scorecard the report is built from.
What to do:
Click the Evaluation: Select evaluation dropdown at the top of the page.
Choose the evaluation you want to report on (for example, Generated Conversations – Solidroad Demo).
The report will load automatically once an evaluation is selected.
Why it matters: Every metric on the page (average score, agent rankings and section scores) is calculated from the evaluation you pick here. Choose the wrong one and the numbers won't reflect the team or scorecard you're interested in.
Step 3: Set your date range and timezone
Reports default to the Last 7 days. You can narrow or widen this to match the period you're reviewing.
What to do:
Click the date range selector in the top-right (it shows Last 7 days by default).
Pick a preset — Today, This week, Last week, Last 7 days, Last 14 days, Last 30 days, Last 3 months, Last 12 months, Month to date, Year to date or All time.
To set an exact window instead, use the calendar to choose a Start and End date and time, and confirm the Conversation date type (for example, Conversation started).
Check the Timezone (for example, GMT+0 Dublin) so your dates line up with your team's working hours.
Why it matters: The date range sets the denominator for every trend and average. It also carries straight through to any export, so getting it right here saves you re-running the report later.
Step 4: Read the report overview
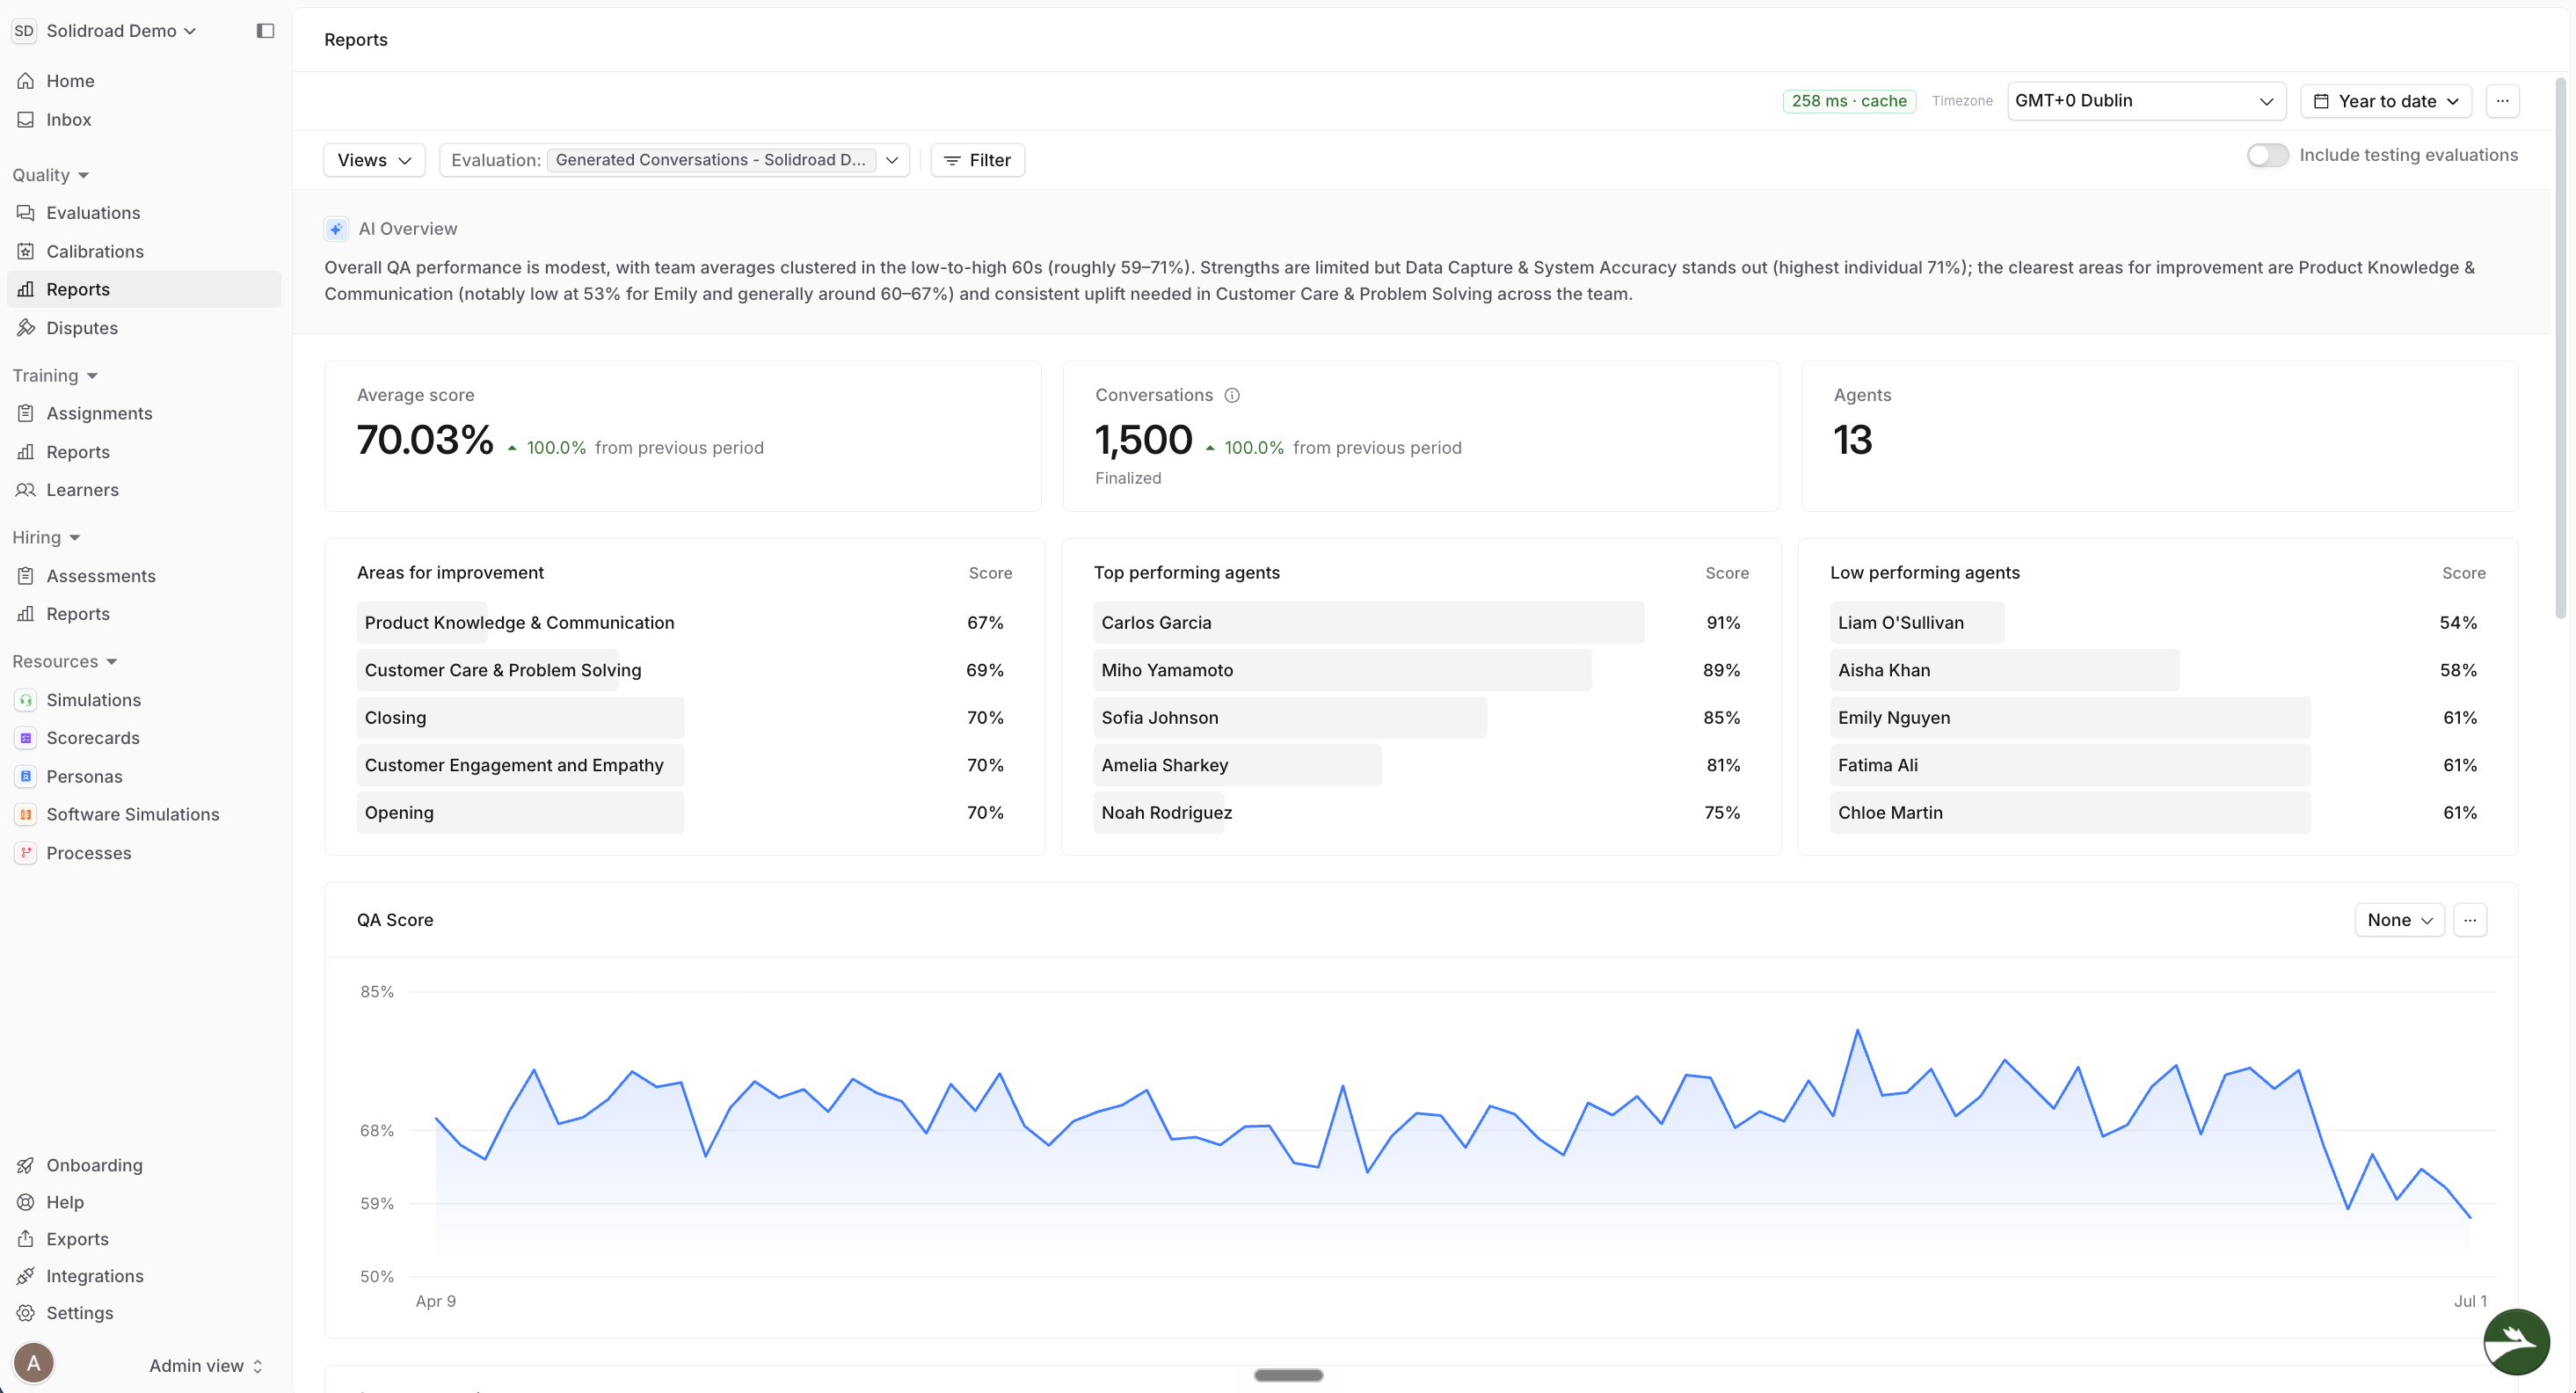
Once an evaluation and date range are set, the report populates with a summary of performance across the period.
What to do:
Read the AI Overview at the top for a plain-language summary of how the team is performing and where the biggest gaps are.
Check the three headline metrics: Average score, Conversations and Agents — each shows the change from the previous period.
Scan Areas for improvement, Top performing agents and Low performing agents to see where to focus.
Use the QA Score chart to see how quality has trended over the selected period
Step 5: Review the section breakdown
The section view shows how each agent scores against each part of your scorecard, so you can see exactly where marks are being lost.
What to do:
Scroll to Score per section below the QA Score chart.
Read across each teammate's row to compare their scores by section — for example Opening, Product Knowledge & Communication, Customer Care & Problem Solving, Data Capture & System Accuracy and Closing.
Look for colour-coded cells (lower scores are highlighted) to quickly spot weak areas across the team.
Why it matters: The overall score tells you who needs support; the section breakdown tells you what to coach. A team-wide dip in one column usually points to a process or enablement gap rather than an individual issue.
Step 6: Drill into an agent or conversation
You can open any agent or individual conversation to see the detail behind the numbers.
What to do:
In Score per section or the agent lists, click an agent's name to open their side panel.
In the panel, review their personal QA Score trend against the Team Average, their Improvement opportunities and the AI Recommendations (for example, "Lead a peer coaching session" or "Complete a targeted simulation").
Scroll to the Conversations list at the bottom of the page (use the Only Finalized dropdown to control which conversations show).
Click any conversation to open the full Transcript and scorecard, with the score for each section and the evaluator's reasoning.
Why it matters: The transcript and per-section scores are where a report becomes a coaching tool — you can point an agent to the exact moment in a real conversation that a mark was won or lost.
Step 7: Export your report
When you want to share results or work with the data elsewhere, you can export exactly what's on screen.
What to do:
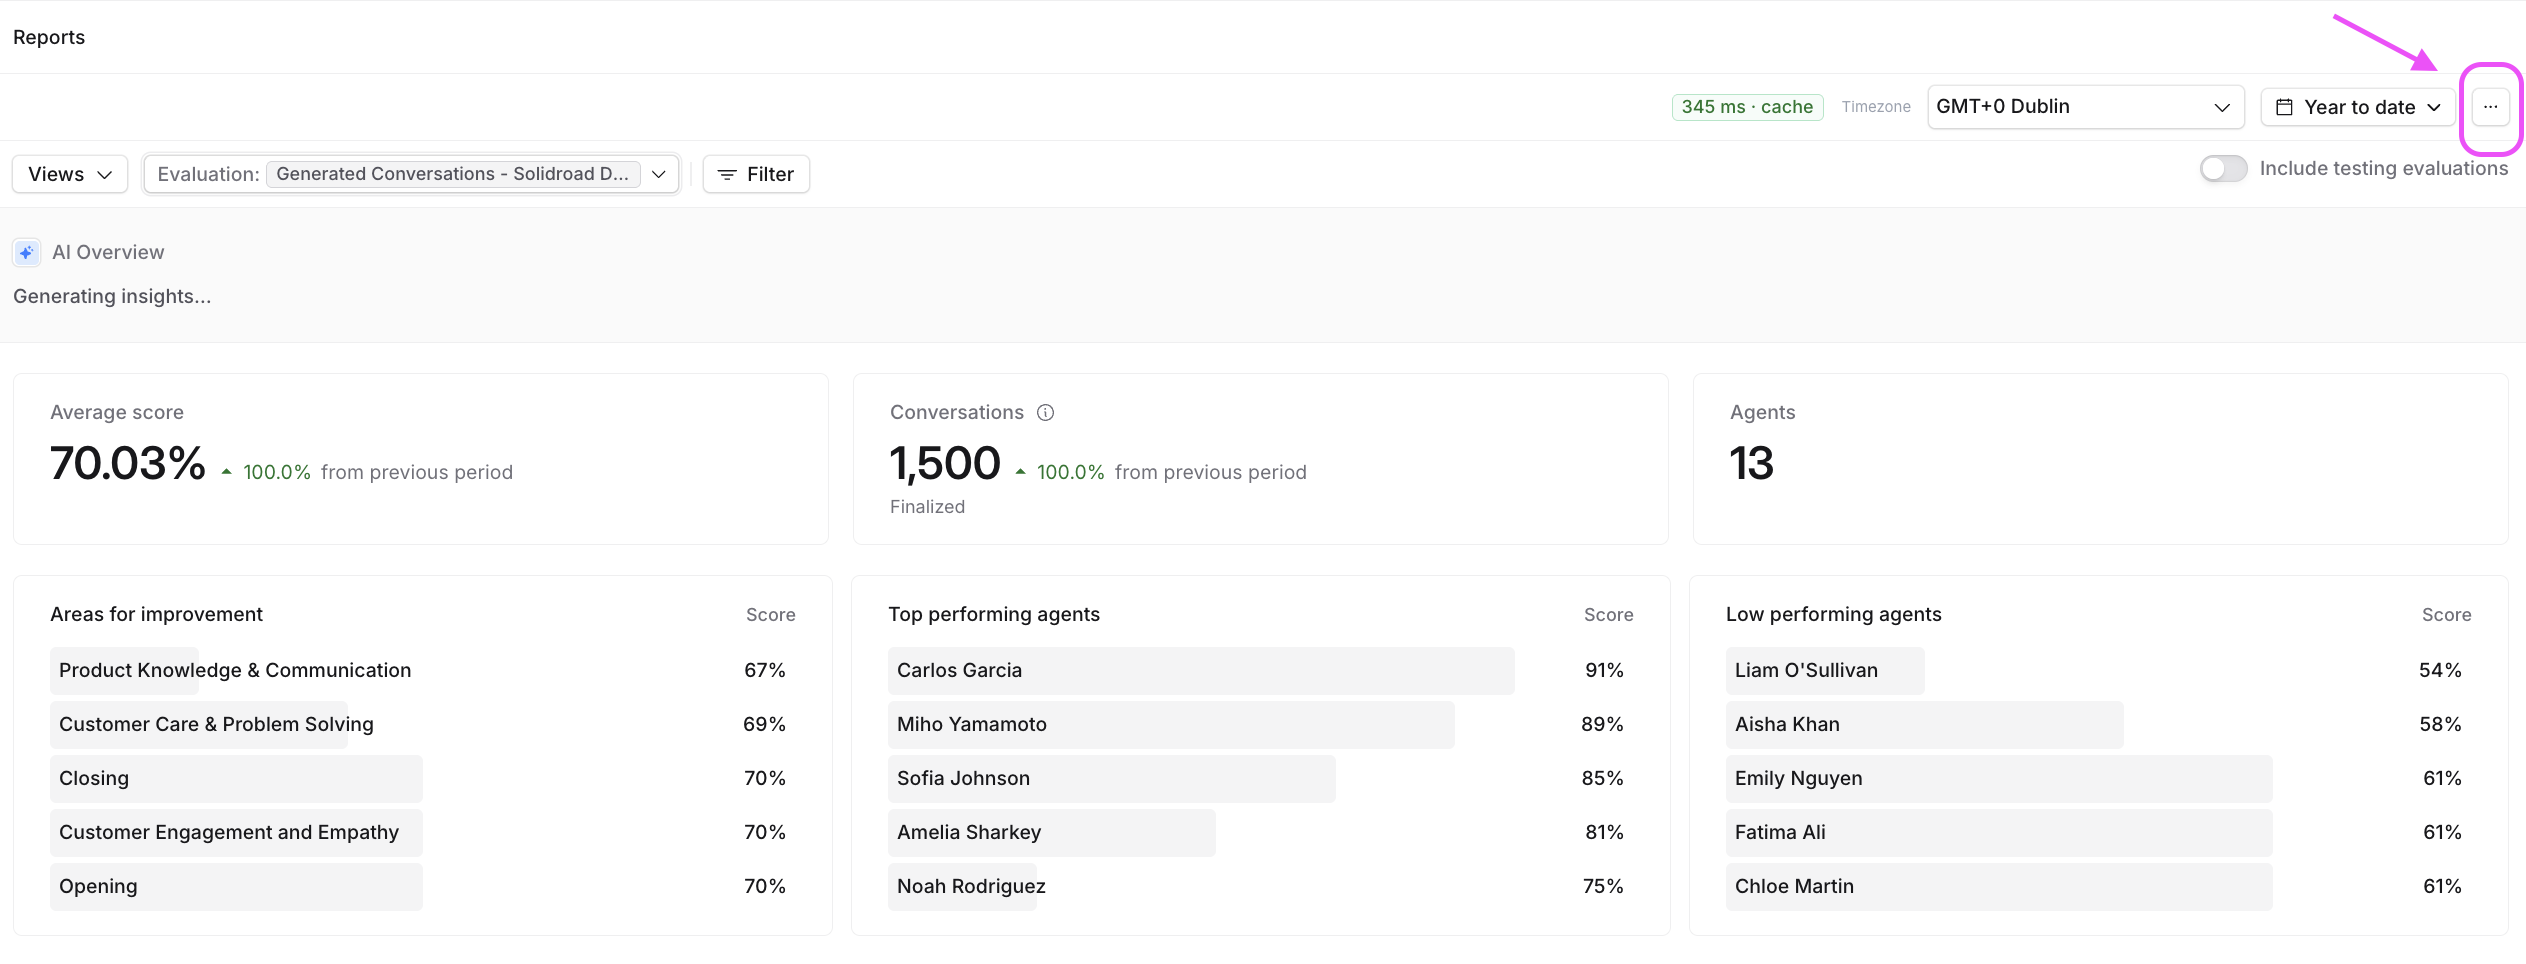
Click the … (more) menu top right, next to the date range, then choose Export report data.
Under Conversations to include, choose one of:
i. All — every conversation in the report, including pending manual reviews.
ii. Only Finalized — excludes pending manual reviews; matches the conversations table.
iii. Only Scored — excludes pending reviews and unscored auto-QA; matches the average-score denominator.
Under Columns to include, tick the fields you want (use Select all or Clear to start quickly). Conversation ID and External System ID are required. Once complete, click Export data.
When the export finishes, find it on the Exports page in the left-hand menu — you'll also get an email when it's ready.
Why it matters: The export inherits the date range, date type and filters already applied to your report. If you need a different set of conversations, close the dialog and adjust the report first, then export.